What should you know About Social Media Marketing Statistics in 2026
Social media usage is now practically an essential part of our everyday lives. With more than 45% of the world's population on social media, it is everywhere! Some use it as a means of entertainment, news consumption, sharing pictures, videos, etc., or staying in touch with family and friends. Additionally, in the last two decades, it has become a low-cost primary marketing channel for businesses to reach customers and increase their ROI. Social media gives marketers insight into how to measure results in sales, leads, and branding.
Therefore, taking into consideration these benefits, it's critical that your business designs an active social media strategy to connect with your target audience. However, before you delve into developing your marketing strategies, it is crucial to look at the social media usage statistics to support your efforts. Here is a list of what you need to know about social media marketing statistics in 2026.
Overall, Social Media Statistics:
Understanding the latest social media advertising statistics and platform-specific performances gives you an idea of what other marketers are doing on different platforms. And most importantly, you'll begin to understand consumer behavior and preferences on social media that can help your consumer approach and lead to conversion.
How Many People Use Social Media?
So, exactly how many people use social media? The 2025 social media surveys indicate that approximately 5.31 billion people worldwide utilize social media, and these numbers are only expected to grow.
The increasing number of social media users can be linked to the fact that the mobile possibility for users keeps improving and is easier to access. Most social media networks are frequently developed as mobile apps optimized for mobile browsing while on the go. Also, they require very minimal resources or know-how to operate.
Daily Usage by Generation
The result of the social media usage by generations, as broken down by e-marketers, is pretty impressive.
The highest numbers of social media users by age are:
Millennials at 90.4%
Generation X at 77.5%
Baby Boomers at 48.2%
Millennials have the highest number of social media users and have the broadest access to smartphones, while Gen X is more active via tablets. And then the Baby Boomers are also bridging their gap by embracing technology and becoming more familiar with social media platforms. When creating your social media marketing adverts, this statistic will help determine your target market.
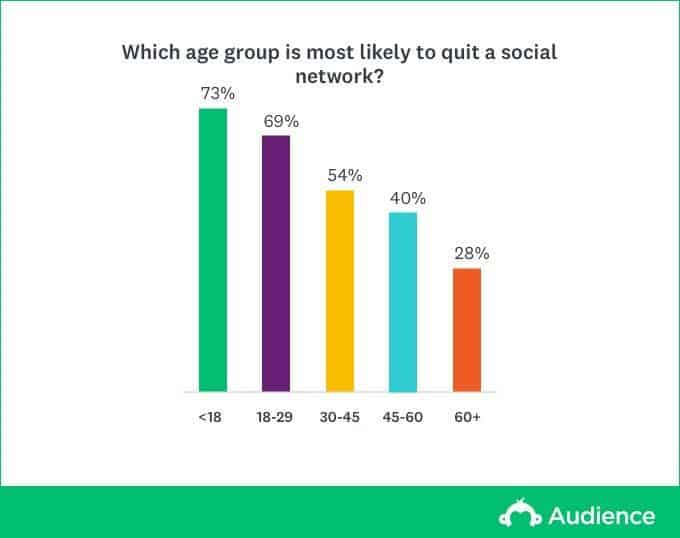
However, on the flip side, another survey carried out by SurveyMonkey on Millennials vs. baby boomers: who quits social media, shows that Millennials and Gen Z generations were more likely than baby boomers to hop on every social media platform. Still, they were also significantly much more likely to quit. While the excitement to get on social media might be higher for younger generations, patience to stay on isn't.
Length of Time Consumers Spend on Social Media?
Another interesting fact about social media usage is how addictive it has become. For one, I can spend hours on my Instagram explore page and log on to search for a specific product. It is effortless for a user to become engrossed and carried away, whether it's scrolling through endless Facebook feeds on a train ride or posting the perfect dinner date photo on Instagram.
According to statistics from GlobalWebIndex, a person can spend an average of 3 hours per day on social networks and messaging. Meaning from the overall time users spend on the internet over half the time goes to social media, according to this infographic by Hootsuite
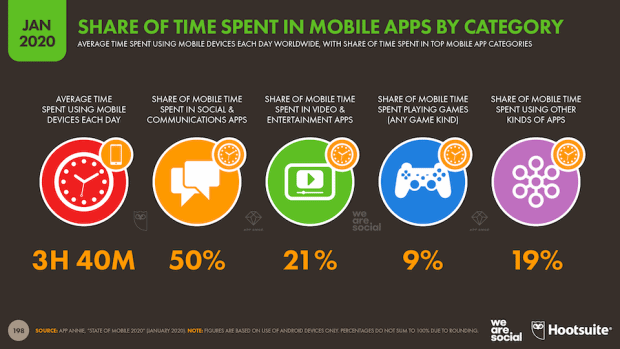
As social media keeps getting more integrated into our daily lives, the countless opportunities for businesses looking for the best means of reaching out to their audience through social media marketing are on the rise.
Summary of Social Media Marketing Statistics by Platforms
Here is a summary of social media stats for some top platforms (Facebook, Twitter, Instagram, YouTube, and LinkedIn ) for your marketing strategies.
Facebook statistics
The Facebook social platform still dominates in terms of usage and ease of reaching your target audience. It remains a favorite among marketers and consumers, according to the Sprout Social Index. Some noteworthy statistics include:
89% of marketers use Facebook for brand marketing campaigns
Over 2.5 million monthly active users live videos are essential for business ads on Facebook, over 68% of marketers have posted their video content on Facebook, while 70% plan to do so in 2025
With over 7 million advertisers, Facebook ads are vital for small-sized companies to help them gain visibility and surpass competitors with ease
74% of users login the app around eight times each day
96% of Facebook users log in via their mobile devices
Businesses whose Facebook ads contain images are 75% and 90% more effective
Weekdays between 10 am to 3 pm are the best hours to post, Wednesday is the best day. For weekends it's from 12 to 1 pm on Saturdays and Sundays and 1 pm to 4 pm on Thursdays and Fridays.
Twitter (X) Statistics
Marketers need to keep an eye on the latest social media statistics on Twitter. Some of these stats include:
Link clicks are your best bet of gaining views and sharing your content, and they account for 92% of all user interaction with tweets
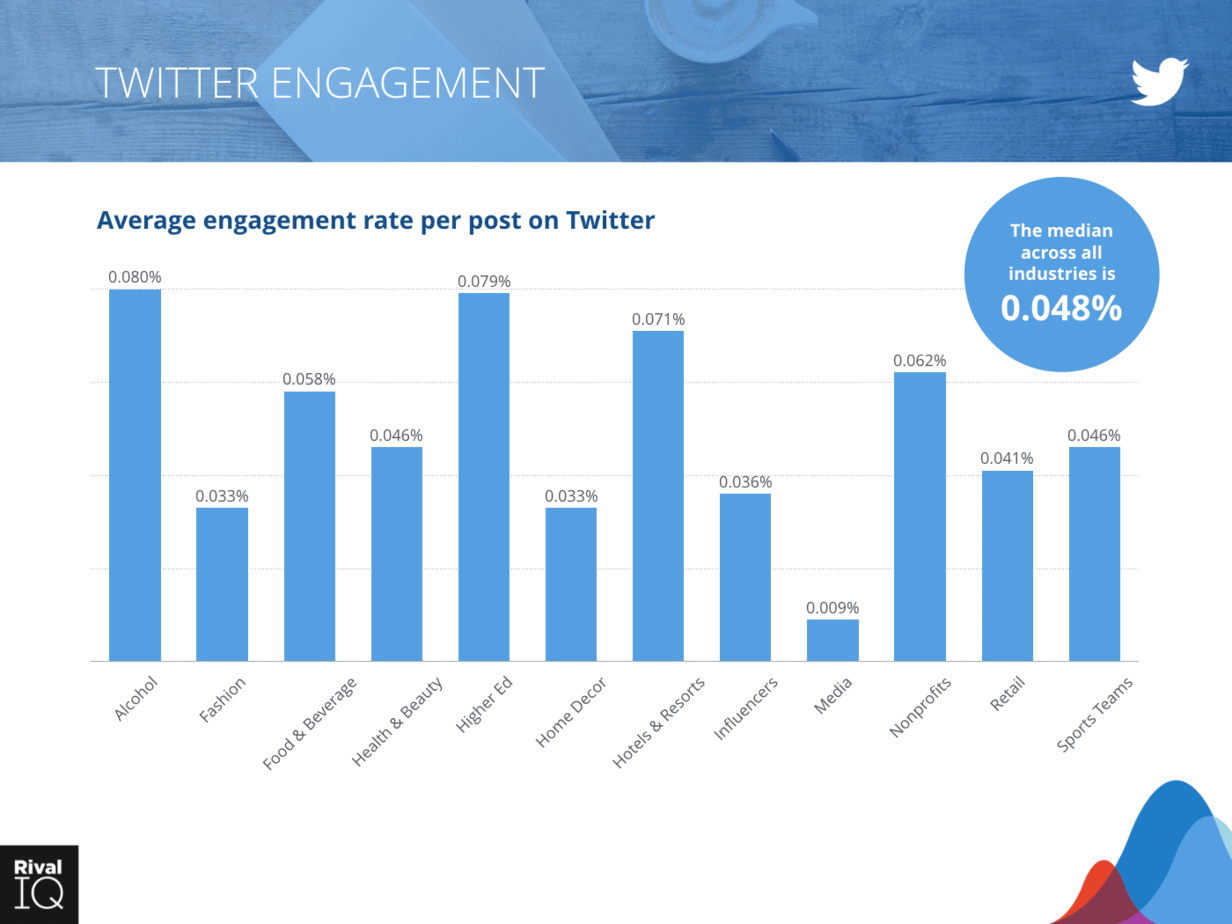
The average median engagement of every 0.86 brand tweet is at 0.048%
Twitter is the best platform to get your consumer reviews
There are over 1.3 billion accounts, but only 336 million are active monthly
Users are 31% more likely to recall what they saw on Twitter in comparison with general online browsing
53% of users say they bought a product they first saw on the app
Twitter ads are 11% more effective than TV ads during live events
Wednesdays and Fridays at 9 am are the best times to post. The best days to post generally are Tuesday and Wednesday, while Saturday has the least engagement.
Instagram Statistics
Of all the social platforms, Instagram most likely the newest features every few months. It is only natural that the platform continues to see an increase in user count and engagement, so here are some stats to consider for your social media marketing strategies:
There are over 1 billion active users, 500 million of which use the app daily and 90% follow a business on the platform, showing keen on hearing from and about brands on the app
Instagram has one of the highest social media engagements, as brands are hitting a median engagement of 1.60% across all sectors on Instagram.
The platform continues to be the most successful influencer marketing, as 89% of marketers say that it's the most vital social media platform for influencer marketing.
Female internet users make use of Instagram more than men, at 38% vs. 26%.
The best times to post are on Wednesdays at 11 am, and Fridays from 10 to 11 am. Wednesday is the day of the week to post, while Sunday has the least engagement
YouTube Statistics
YouTube remains your go-to platform for video content. YouTube mobile alone, reaches more 18-49 year-olds than any of the cable networks in the US and with over 1.8 billion monthly active users here are a few other YouTube stats you need to consider:
83% of YouTube consumers say it is the preferred form of social media marketing worldwide
54% of YouTube users want marketers to put out more video content, making it an excellent marketing tool
Most consumers are mostly male, with a 55% men to 45% women ratio
Over half of YouTube views are via mobile devices, and the average mobile viewing session lasts more than 40 minutes.
LinkedIn Statistics
With a completely different audience type, LinkedIn has the largest professional network. Thus, this makes it the ideal platform for Business-2-Business (B2B) marketers. Here are some LinkedIn statistics for marketers to consider:
LinkedIn now has over 660 million users worldwide with 303 million of them being active monthly
More than 30M companies represented on LinkedIn
LinkedIn is in over 200 countries and also available in 24 languages
Marketers have gained over 45% of customers through LinkedIn
65% of B2B companies make use of LinkedIn paid ads to get clients
95% of B2B content marketers use the platform for organic content marketing campaigns
It is best to post on Wednesdays between 9 to10 am and at 12noon. Wednesdays have the most engagements, while Sundays have the least.
The number of marketers sharing video content on LinkedIn is currently around 55% and is projected to rise to 65% in 2021.
Conclusion
Whether you're a blogger, marketer, or company, social media marketing provides an excellent platform for billions of more potential readers, customers, and subscribers. However, these users can only be reached and engaged if you have a better understanding of how these platforms work. So, I hope these statistics can help you as you work on improving our marketing strategies for 2026.
Related Articles
How to Relaunch a SaaS After Failure: Step-by-Step
Failed your first launch? Learn how to strategically relaunch a SaaS after initial failure by aggressively pruning features, re-validating the market, and building a real distribution engine.
How to Avoid Keyword Cannibalization on Startup Websites
Learn why fast-moving startups accidentally create SEO 'civil wars' between their own pages and how to fix it. Discover practical strategies to structure your site, audit your content, and avoid keyword cannibalization for consistent organic growth.
A Simple Chrome Extension Launch Checklist for Makers
Stop launching to zero installs. Use this proven Chrome extension launch checklist to pass Google's strict review process, optimize your store listing for organic search, and acquire your first 1,000 active users.